The four-star cliff: how a moving quality line reprices Medicare Advantage
At 4.0 stars a contract earns a 5% benchmark bonus; miss the line and that bonus is gone, while the rebate share it keeps sits on a separate, wider schedule.
Gript Technologies · Medicare Advantage research
All figures in this note come from public CMS Medicare Advantage and Part D Landscape and Star Ratings files, aggregated by MA Benchmarker, our Medicare Advantage benchmarking tool. MA-PD contracts only.
In Medicare Advantage, a half-star is money, but it does not all turn on one line. Cross the 4.0-star threshold and a contract earns a 5% bonus to its county benchmark, 10% in the subset of “double-bonus” counties, where the stakes of the four-star line are twice as large. The share of the rebate it keeps runs on a separate, wider schedule: 50% at 3.0 stars and below, 65% at 3.5 and 4.0, and 70% at 4.5 and above. So a drop from 4.0 to 3.5 erases the benchmark bonus while leaving the rebate share untouched at 65%; the rebate only falls to 50% at 3.0, and only climbs to 70% at 4.5. Two overlapping cliffs, not one, which makes the star rating one of the largest single swing factors in a plan’s economics, and one of the least stable.
The share of the market sitting above the bonus line has moved by more than twenty points in the span of a few years, driven as much by shifting scoring rules as by shifting performance. Treating a plan’s current star rating as a durable moat is one of the more common mistakes in MA underwriting. It is better read as a leveraged, policy-driven input that resets on a two-year delay, and the layer that actually predicts next year’s rating sits one level below the number everyone quotes.
What the numbers actually say
By contract, the share of MA-PD plans at or above 4.0 stars ran about 52% in 2020, dipped, spiked to roughly 68% in 2022, then fell to about 42% by 2024. The 2022 spike was policy, not performance: pandemic-era disaster provisions let plans keep the better of two years on many measures, and nearly every contract qualified, temporarily inflating ratings. As those provisions rolled off, and as CMS tightened the statistical machinery that sets the thresholds, ratings normalized down hard.
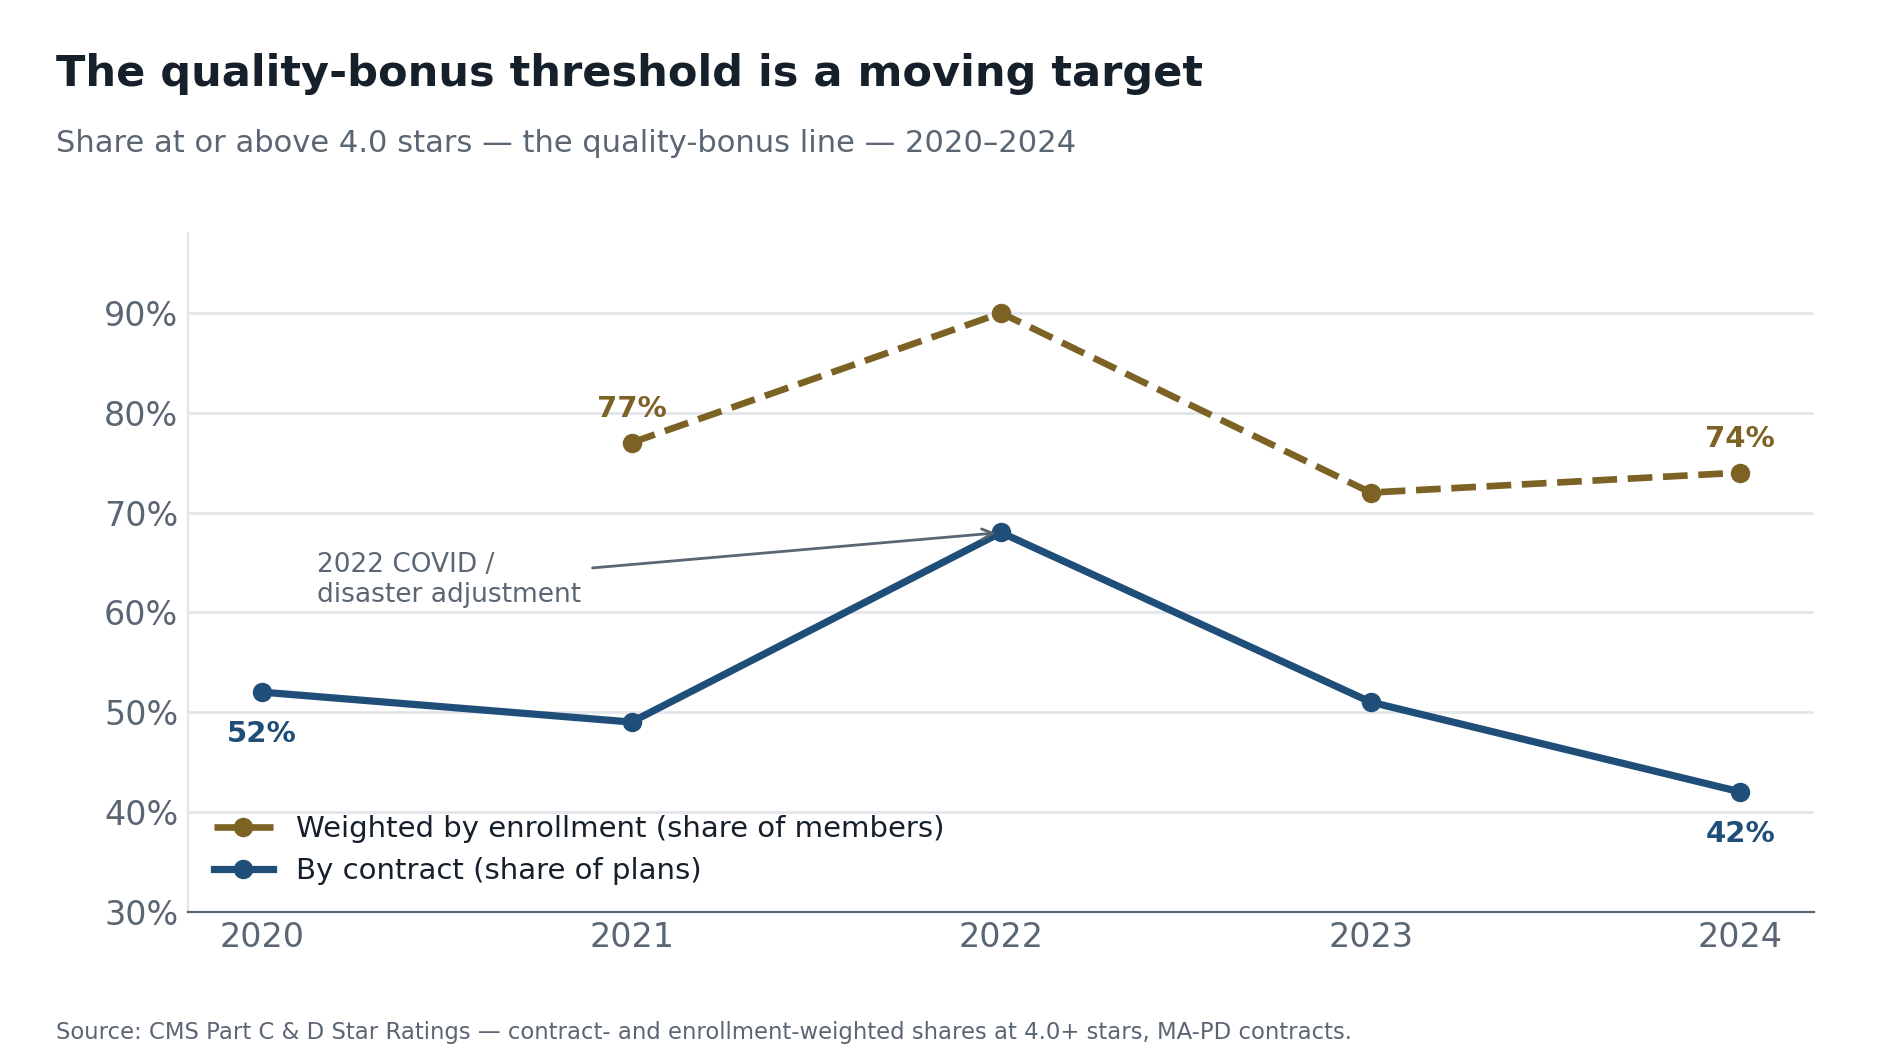
Weighted by enrollment the picture diverges, and the divergence is the point. The member-weighted share peaked near 90% in 2022, dipped to about 72% in 2023, then ticked back up to about 74% in 2024 even as the by-contract share fell to its low of 42%. In other words, while more contracts, often smaller ones, slipped below four stars, members stayed concentrated in large, higher-rated plans. Bonus dollars concentrate the same way: a handful of large contracts hold most of the enrolled, bonus-eligible members, so the money at stake rides on whether those few plans hold their stars. A single downgrade at a large contract moves the market’s member-weighted number more than a dozen downgrades among small ones, which is exactly why a portfolio’s exposure can look stable at the member level while the contract distribution deteriorates underneath it.
Beneath the averages, the churn is real, and independent tallies are harsher than the shifting distribution suggests. Of contracts rated in both 2023 and 2024, roughly 42% declined and only about 21% improved, with the rest holding. A better-than-two-in-five chance of a downgrade in a single cycle is not the profile of a stable moat; it is the profile of a variable input.
The distribution matters as much as the average, and there are several thresholds, not one: the 5% benchmark bonus at 4.0, the top rebate tier at 4.5, and, vanishingly rare, a five-star rating that adds a year-round enrollment advantage on top. Plans cluster just beneath these lines, which is exactly what makes the market fragile: when a cut point moves up by a few points of raw performance, it can sweep a whole cohort of 4.0 contracts down to 3.5 at once, stripping the bonus from every one of them. The share above 4.0 is not a smooth gradient; it is a stack of plans balanced on a line that CMS redraws every year.
Why stars punish late
Two features make stars treacherous to underwrite. First, they lag. The rating a plan is paid on reflects performance from two to three years earlier, a measurement year, then a rating year, then the payment year it drives, so the market often prices a plan on stars that already describe the past. A contract can be operationally deteriorating for a year before the rating catches up, and improving for a year before it gets credit.
Second, the summary rating is a weighted average of dozens of measures, several of them volatile and only loosely under management control in any given year, and the thresholds themselves move. Cut points, the raw-score boundaries between three, four, and five stars, are set relative to the field each year through clustering, so when performance rises across the board the bar rises with it. Recent methodology tightened this further: beginning with the 2024 ratings, CMS deletes statistical outliers from both tails of each measure’s distribution, a Tukey outer-fence rule, before drawing the cut points. Removing extreme scores this way reshapes the clusters, and in practice it lifted many cut points, most sharply at the lower 2- and 3-star boundaries, so a plan could hold its raw performance flat and still lose a star.
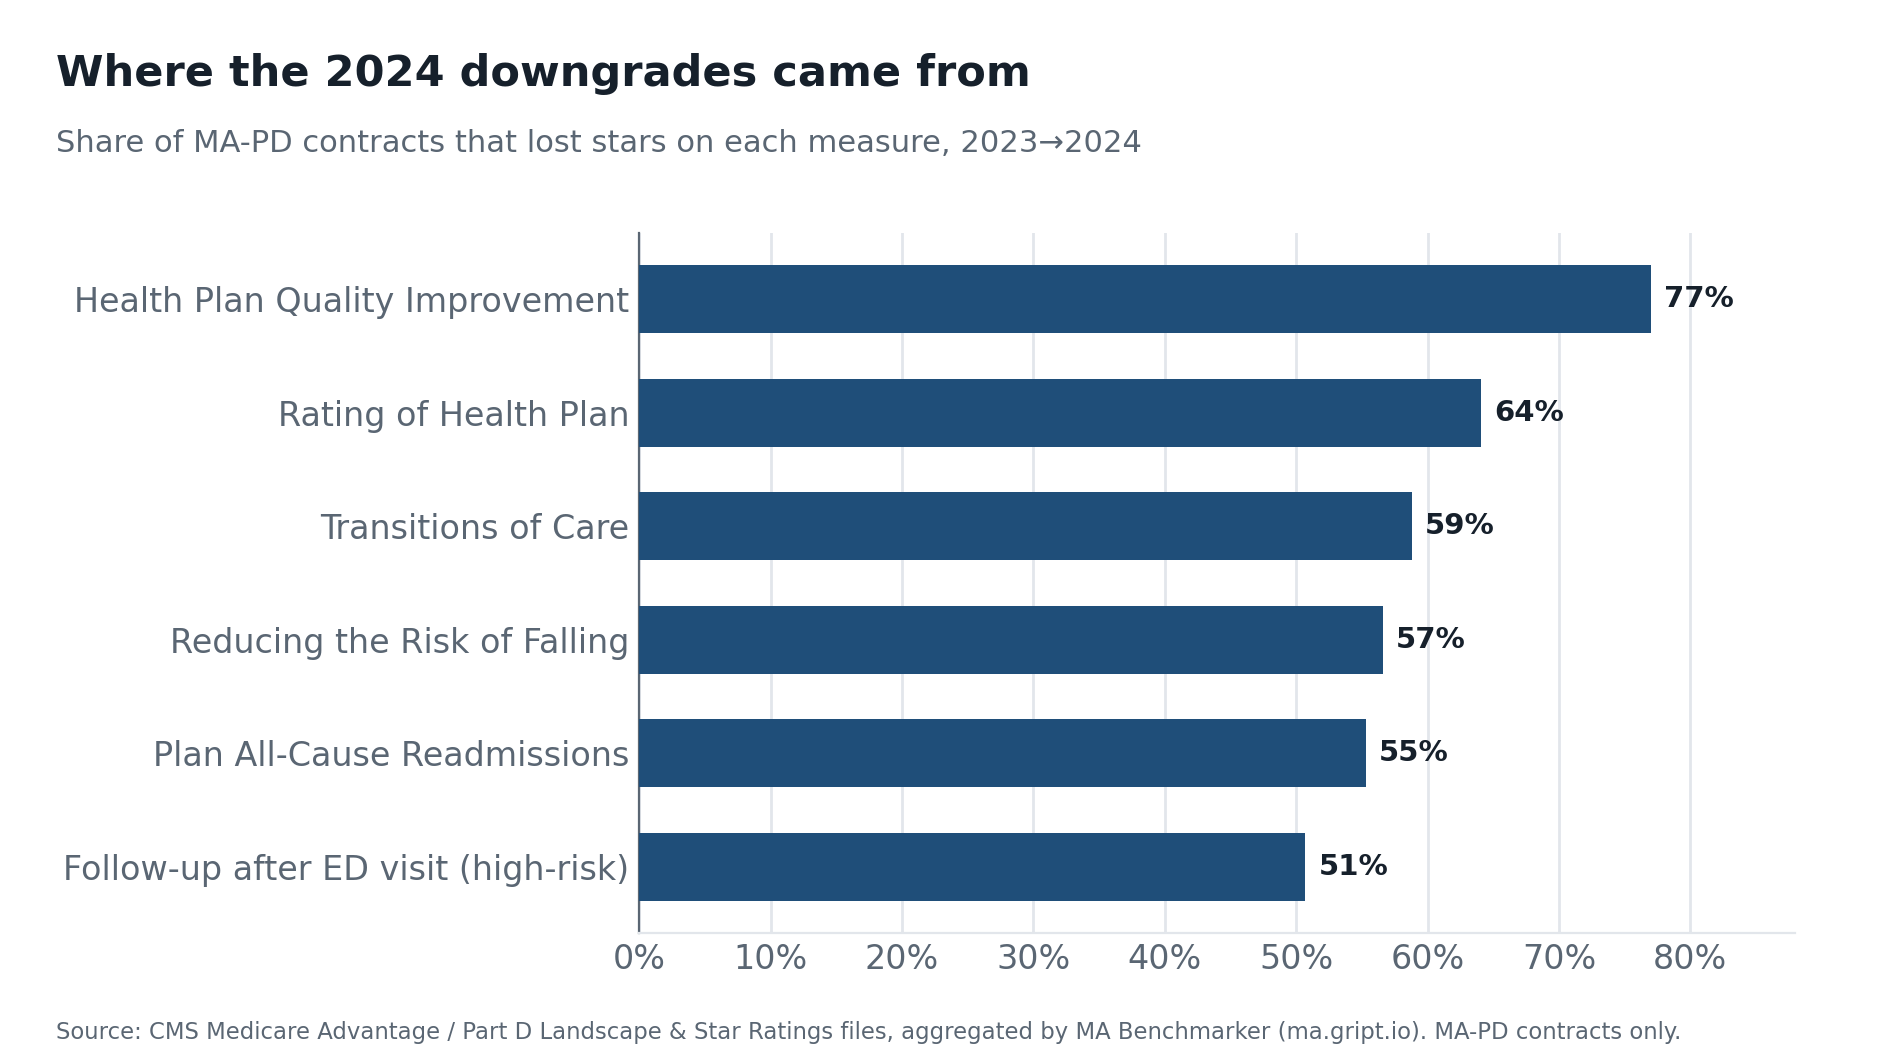
Exhibit 4 shows where the 2024 downgrades actually came from, and the mix is telling. The single most-downgraded, Health Plan Quality Improvement, is a meta-measure built from year-over-year score changes across other measures, volatile by construction and carrying the program’s heaviest weight, so it swings hard and moves the summary rating when it does. The rest span the whole program: Rating of Health Plan is a patient-experience survey measure; Transitions of Care, all-cause readmissions, and post-ED follow-up are HEDIS clinical measures; fall-risk comes from the health-outcomes survey. What they share is not that they are “soft,” but that they are unusually sensitive to year-to-year noise and to a cut point that moved under them. That is the quiet risk: a contract can hold its operational performance flat and still lose the bonus because the curve moved. For an investor, it means the summary star is the wrong unit of analysis. The leading signal lives one level down, in the measure-level trajectory and the distance to each cut point.
A contract can hold its performance flat and still lose the bonus, because the line moved.
The cliffs compound across the range, though not at a single line. A drop from 4.0 to 3.5 stars strips the 5% benchmark bonus but leaves the rebate share at 65%; a further slide to 3.0 cuts that share to 50%; a climb from 4.0 to 4.5 keeps the bonus while lifting the rebate share to 70%. A contract sitting at 4.0 thus has a bonus cliff just below it and a richer rebate tier just above, so small rating moves reprice it in both directions. And the scoring rules keep shifting underneath all of it: CMS raised patient-experience measures to a 4x weight beginning with the 2023 ratings and held it there, so in the 2024 downgrades a single survey measure could move the summary hard, and is only now reversing course, cutting that weight back to 2x starting with the 2026 ratings, even as the quality-improvement measures carry a 5x weight. The summary rating moves on weight changes as much as on performance. That is the gap between what a star rating looks like and what it is: a leveraged, partly exogenous input dressed up as a durable quality score.
A map for buyers and diligence teams
Underwriting a plan’s star economics comes down to a few questions the headline rating will not answer:
- How close to the cliff? For a 4.0 to 4.5 contract, how many measures sit within one cut-point of a downgrade, and what is at risk at each step: the 5% benchmark bonus if it slips to 3.5, the rebate tier itself only if it falls to 3.0?
- Earned or inflated? How much of the current rating rode disaster provisions or one-time adjustments that will not repeat, versus durable operational performance that should hold as cut points tighten?
- Which measures, and are they controllable? Separate measures the plan can manage (care coordination, medication adherence) from those exposed to cut-point drift, survey volatility, or methodology changes it cannot control.
- What is the two-year picture? Because payment lags, underwrite the measure-year performance already in the pipeline, not the rating currently being paid. The future is partly already observable.
- What does a downgrade cost, in dollars? Translate a half-star move into the specific change in benchmark bonus or rebate share, which depends on exactly which threshold it crosses, then into the benefits at risk and the membership elastic to them, market by market.
Where this lands
Stars behave less like a moat and more like a leveraged, policy-driven input that resets on a delay. The market’s share of bonus-eligible plans has shown it can move twenty points in two years; more than two in five contracts can be downgraded in a single cycle; and the moves are driven as much by shifting cut points as by shifting performance. For a portfolio, the implication is to monitor the layer beneath the summary rating, the measure-level trajectory and the distance to each cut point, because that is where next year’s rating, and next year’s rebate, is already being decided. The plan with the best current star is not necessarily the plan with the safest one, and the difference is only visible if you look below the number.
Explore the underlying data
Contract-level star, cut-point, and benchmark analytics behind this note are available in MA Benchmarker, our Medicare Advantage benchmarking tool at ma.gript.io. Gript Technologies advises funds, operators, and health systems on Medicare Advantage strategy and diligence.
This analysis uses only public CMS Medicare Advantage and Part D data, aggregated at the market level across rated MA-PD contracts. It names no individual plan and is for informational purposes only; it is not investment advice.