The zero-premium ceiling: what a saturated premium lever signals for MA margins
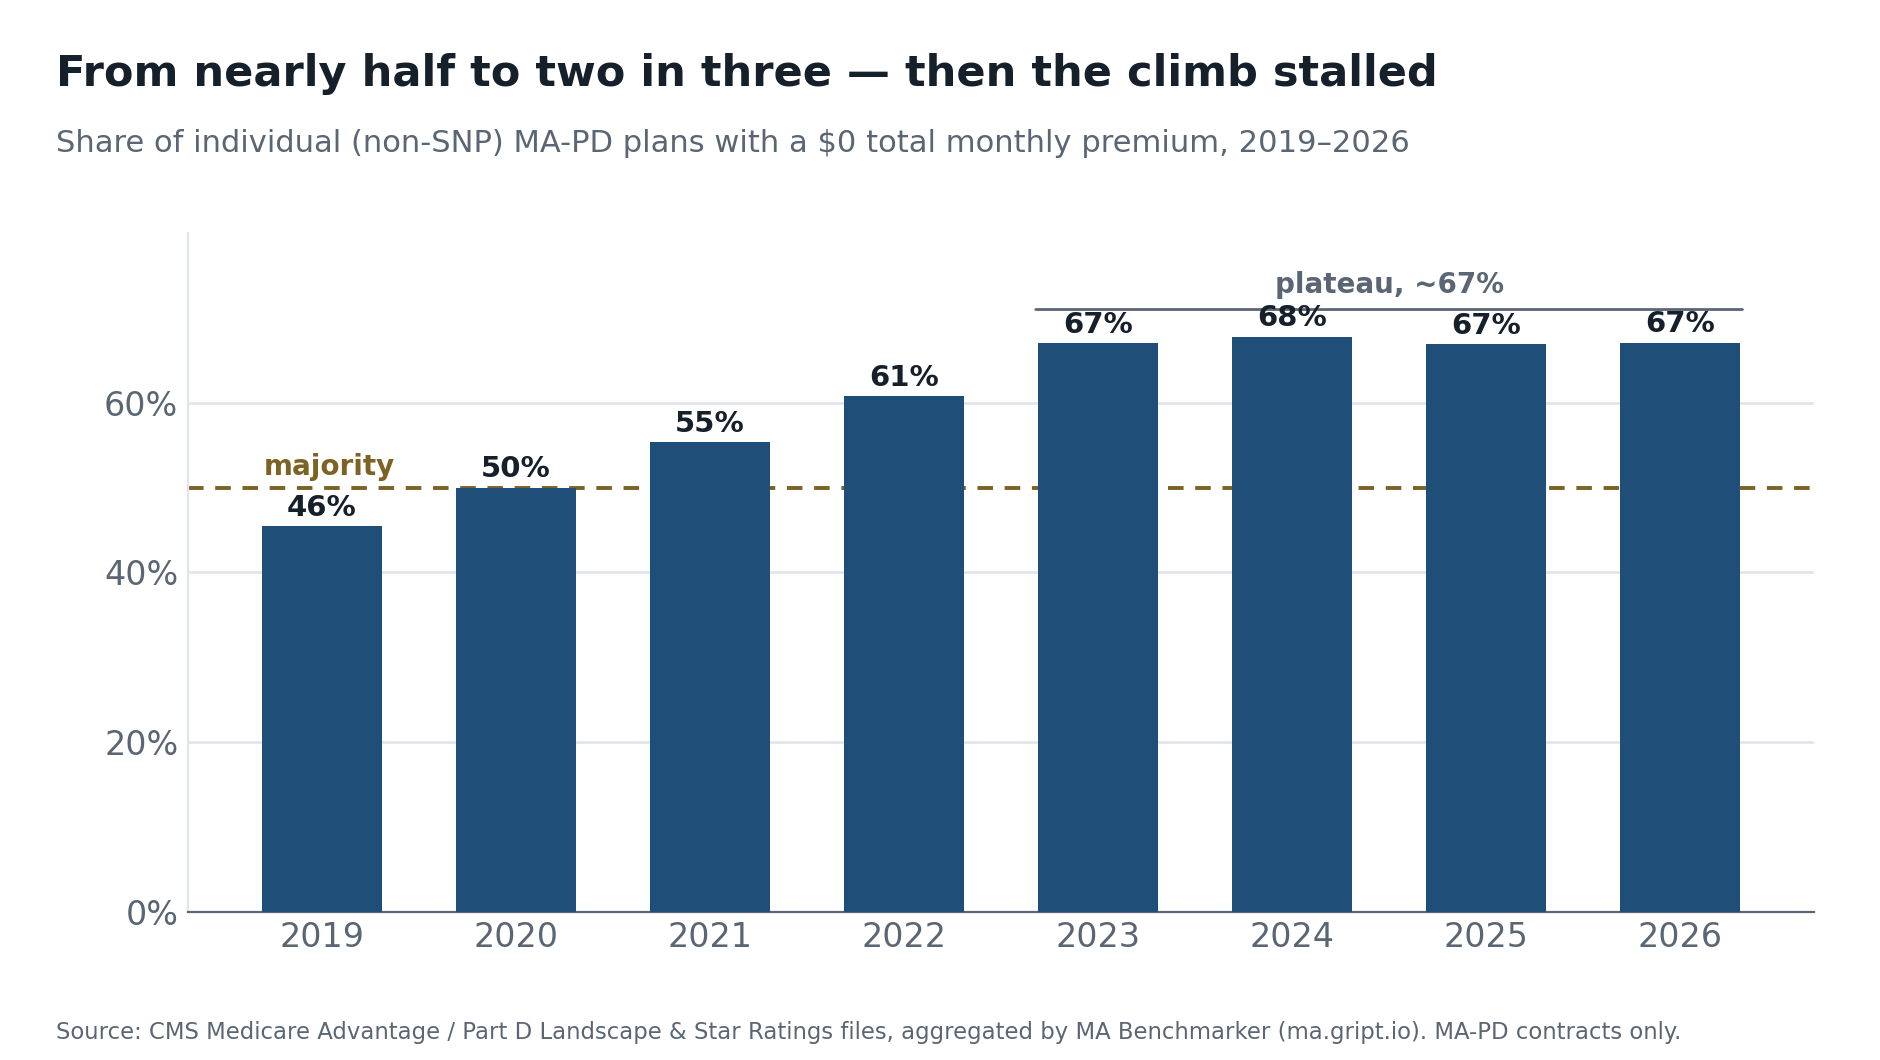
Nearly half of individual Medicare Advantage plans were free in 2019; two in three are today, but the share stopped climbing around 2023, and the plans that still charge held their price.
Gript Technologies · Medicare Advantage research
All figures in this note come from public CMS Medicare Advantage and Part D Landscape and Star Ratings files, aggregated by MA Benchmarker, our Medicare Advantage benchmarking tool. Individual, non-SNP MA-PD plans only, deduplicated to one row per plan.
The most-quoted number in Medicare Advantage is the one a shopper sees first: the monthly premium. For roughly two-thirds of individual plans, that number is now zero. It reads like generosity. It is closer to customer acquisition, and, for an investor, a signal about where a plan’s economics have already been.
Among individual, non-SNP MA-PD plans, the share charging a $0 total premium climbed from about 46% in 2019 to roughly 67% by 2023, and then stopped. It has held near two in three ever since. The median individual plan became free around 2021, and the market has since saturated that lever. This is not a story of relentless acceleration; it is a story of a lever reaching its ceiling. For a fund underwriting a carrier, or a strategic weighing a market, that distinction matters: the easy phase of premium competition is over, and what a plan does next is more revealing than what the premium already shows.
What the numbers actually say
A word on method first. These figures cover individual, non-SNP MA-PD plans, the universe most comparable across years and closest to what a retail shopper sees, deduplicated to one row per plan. Special Needs Plans, which serve dual-eligible and chronic-condition populations under different economics, are set aside. In our Landscape-file tallies, including SNPs actually lowers the $0 share, because many carry a listed premium, though for dual-eligible members that premium is often covered by Medicaid or the low-income subsidy, so a listed premium is not always a paid one. These are our counts from the public CMS files and can differ modestly from other published tallies depending on universe and de-duplication choices; where they can be compared, they track KFF’s landscape analyses closely.
The first exhibit is the mix. The $0 share rose steadily through 2023, then plateaued near 67%. One caveat worth stating plainly: this is the share of plans offered, not the share of members enrolled. Enrollment concentrates disproportionately in free plans, so the member-weighted figure runs higher still. KFF puts the share of MA-PD enrollees in $0-premium plans near three-quarters, about 73% in 2023 and 76% in 2025. Plan availability understates, not overstates, how default “free” has become.
The second exhibit is the price, and it corrects a tempting misreading. The average premium across all individual plans fell from about $38 a month in 2019 to roughly $22 today. But that decline is almost entirely composition: as more plans moved to $0, the average was dragged down. Isolate only the plans that still charge a premium and the average barely moves, near $70 in 2019 and still in the high-$60s today, dipping into the low-$60s mid-decade. In nominal terms that is roughly flat; after a run of cumulative inflation it is a real-terms cut, but nothing like the collapse the all-plan line implies. The market did not talk its premium-charging plans into slashing price; it moved plans into the free column and left a broadly stable premium tier behind.
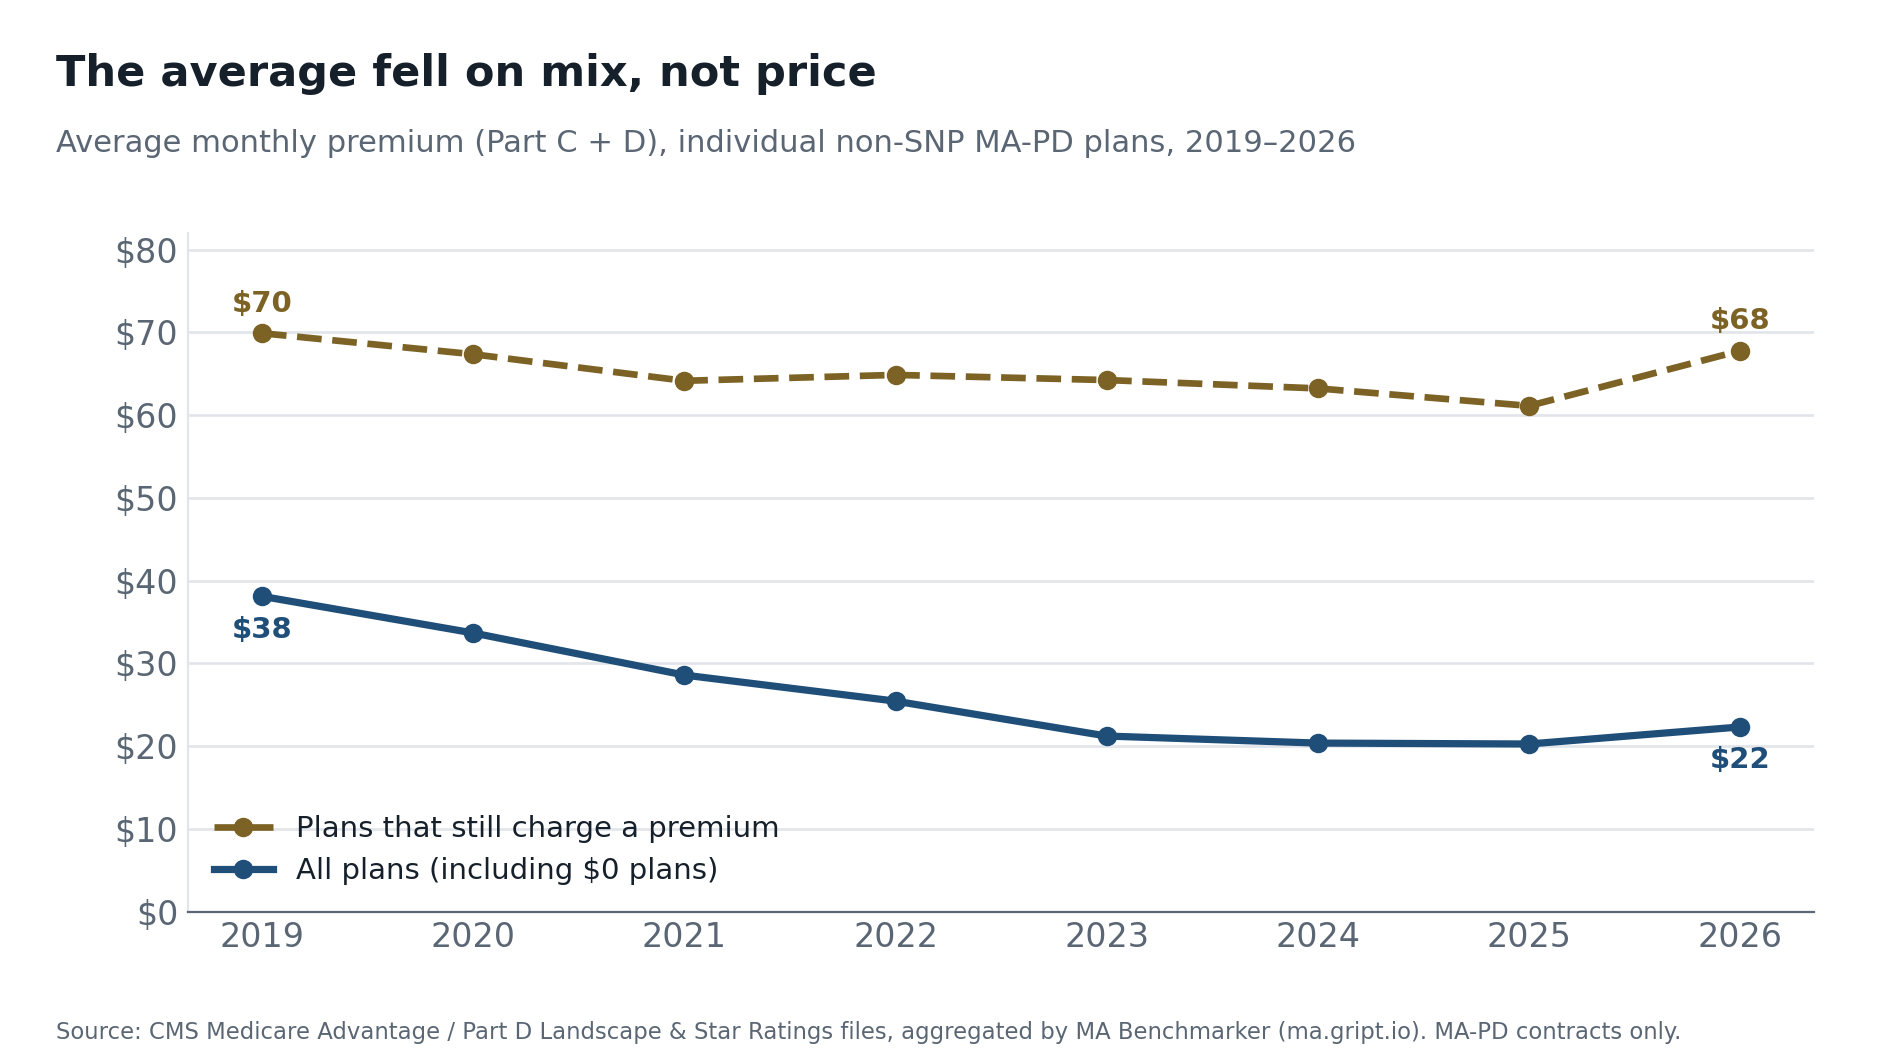
Read together, the exhibits describe a market that has spent its most visible lever: it has sorted into two camps, a saturated free tier at roughly two-thirds of plans, and a stable, premium-charging tier holding the rest.
Why ‘free’ is expensive
A $0 premium is not the absence of cost; it is a financing choice. MA plans bid against a county benchmark set by CMS. When the bid comes in below the benchmark, the plan keeps a share of the difference as a rebate that must be spent on the member: lower cost-sharing, richer supplemental benefits, or buying the premium down toward zero.
The size of that rebate share is itself tied to quality. Higher-star plans keep a larger fraction, as much as 70%, and, at four stars and above, earn an additional 5% bonus to the benchmark they bid against. A free premium wrapped in a rich benefit package is, in effect, rebate dollars routed to the shopper’s eye.
That makes premium a spent lever, and the plateau is what a spent lever looks like: the free share stops rising not because competition eased but because it ran out of room. The growth it bought is, to a degree, rented. It rides a favorable spread between bids and benchmarks that is not guaranteed to persist, and benchmarks are policy variables that move with county fee-for-service costs, statutory caps, and quartile adjustments.
And the floor is not quite zero. A growing set of plans now competes below it through the Part B premium giveback, rebating members part of their standard Medicare Part B premium, so for some, “free” has become “paid to enroll.” But that lever is funded from the same rebate pool, and for most plans the practical floor remains $0. When the rebate compresses, the adjustment lands where a $0 premium cannot absorb it: on benefits.
That rebate pool is more volatile and more policy-dependent than the plateau suggests. Average payments to MA plans dipped in 2024 and 2025, then rebounded sharply for 2026, when CMS finalized an effective growth rate above 9% and per-enrollee rebates reached record highs of more than $2,600. Underneath that swinging headline, two structural forces still press on the per-member math: the CMS-HCC V28 risk model, phasing in through 2026, compresses the risk scores that drive revenue, and star ratings, the multiplier on the rebate calculation, have normalized down from their pandemic highs. The point is not that funding is on a straight path down; it is that it swings with policy, year to year, in ways a plan cannot control, which is exactly why growth financed by it is rented rather than owned.
Handed record rebate dollars in 2026, plans did not push price lower. For most it is already at the floor.
One fact from 2026 sharpens the thesis rather than softening it: even as rebate dollars hit an all-time high, the $0-premium share did not move. Plans routed the surplus into benefits and givebacks instead. That is what a maxed-out lever looks like. And when the rebate does compress, the adjustment cannot land on a premium that is already zero; it lands on benefits, a quiet reduction at the next annual filing, and a known driver of member switching.
What comes after premium
If price is a spent lever, where does competition go next? The same rebate dollars that once bought the premium down now flow into visible supplemental benefits, dental, vision, hearing, over-the-counter allowances, the flexible spending “flex card,” and into the Part B giveback, which has spread fast: KFF finds 32% of plans offered a Part B premium reduction in 2025, up from 19% a year earlier. These are the new shelf-differentiators, and also the new pressure valves. Unlike premium, they can be trimmed quietly, a few dollars of allowance or a narrower network at a time, without the stark optics of re-introducing a premium.
That trimming is already underway, and, tellingly, in a record-rebate year. Between 2025 and 2026, KFF reports, the share of plans offering an over-the-counter allowance fell from 73% to 66%, meal benefits from 65% to 57%, transportation from 30% to 24%, and remote-access technology from 53% to 48%. Even with the headline funding number at a high, plans pared the visible package. For an investor, that reframes what to monitor: the competitive story has left the premium column and now lives in the year-over-year richness of the supplemental benefits and the giveback, and in which a plan cuts first when its per-member economics tighten. The most exposed are the plans whose growth leaned hardest on a benefit package they are now quietly paring back.
A map for buyers and diligence teams
For a fund underwriting an MA carrier, or a strategic weighing entry, the premium picture reframes a handful of diligence questions:
- How much of the growth is rented? Decompose recent membership gains into markets where the plan’s rebate spread widened versus markets where it took share on margin. Rented share reprices when benchmarks and risk scores do; earned share is stickier.
- What funds the $0, or the giveback? Trace the rebate: how much of the benefit package, premium buydown, and Part B giveback depends on the current benchmark, risk scores, and star bonus, and what happens to it under a half-star downgrade, a V28 step-down, or a benchmark that grows below trend?
- Where is the margin actually made? A $0 premium says nothing about profitability. Which counties carry the book, are they priced to earn or to buy share, and how concentrated is the profit in a handful of markets?
- How exposed is the benefit package? If the plan had to find, say, $30 PMPM, which supplemental benefits or givebacks get cut first, and how elastic is this plan’s membership to those specific cuts in its specific markets?
- Is the premium a buffer or a spent lever? A plan still charging a premium holds an invisible buffer. It can spend the premium down to defend share, or hold it to absorb a funding cut without members noticing. A plan already at $0 can still adjust, but only through member-facing benefit cuts that carry disenrollment risk. Both have a lever; only one can pull it without the member seeing. In a tightening environment that difference is worth more than it looks, which is why a modest premium is not always weakness.
Where this lands
Premium was the easy lever, and the market has pulled it about as far as it goes, hence the plateau at two-thirds of plans free, with a stable premium tier holding the rest. Price is no longer where the next round of MA competition will be decided; benefits, givebacks, and stars are. For investors, that shifts the question from “how cheap is it?” to “how is the cheapness funded, and what breaks when the funding does?” The plans that look strongest on a shopper’s screen, free and benefit-rich, are not automatically the strongest on a cash-flow model; the two can look identical from the outside and diverge sharply under a benchmark cut. The premium is the visible tip; the rebate economics underneath it are where durability lives. When a plan can no longer buy attention with premium, the first place strain shows up is a quiet benefit reduction at the next annual filing, precisely the leading indicator worth monitoring across a portfolio, market by market, before it reaches the enrollment file.
Explore the underlying data
Plan-level premium, benchmark, and star-rating analytics behind this note are available in MA Benchmarker, our Medicare Advantage benchmarking tool at ma.gript.io. Gript Technologies advises funds, operators, and health systems on Medicare Advantage strategy and diligence.
This analysis uses only public CMS Medicare Advantage and Part D data, aggregated at the market level across individual, non-SNP MA-PD plans (deduplicated to one row per plan). It names no individual plan and is for informational purposes only; it is not investment advice.